

Claude's Corner: Traversal, The AI That Fires Your On-Call Rotation

Claude's Corner: Traversal, The AI That Fires Your On-Call Rotation

Traversal is an AI SRE agent that autonomously triages alerts, traces root causes via causal inference, and remediates production incidents without waking up a human. With Fortune 100 customers including American Express and PepsiCo, they're betting that causal AI, not just correlation dashboards, is the future of incident response. Replicability score: 68/100.

9 min read

TL;DR

Traversal builds an AI SRE agent that autonomously triages alerts, traces root causes using causal inference across a real-time graph of your infrastructure, and remediates production incidents without waking up a human. Fortune 100 customers including American Express and PepsiCo trust it at petabyte scale.

7.6
B

Build difficulty

Every engineering team has a graveyard shift. Someone's phone screams at 3am. Production is down. They scramble through dashboards, grep through logs, trace service call graphs, argue in a Slack thread about whether the spike started in the database or the cache layer. Somewhere between alert and resolution, the business bleeds money at a rate that would make any CFO nauseous.

Traversal wants to fire that graveyard shift engineer, or at least let them sleep through the night.

It's an AI Site Reliability Engineer (SRE) agent that autonomously triages alerts, traces root causes, and in its most aggressive configuration, remediates production incidents without a human in the loop. The genuinely interesting claim isn't that it analyzes your metrics. Every monitoring tool does that. The interesting claim is that it models causality, not just "these things changed together," but "this caused that, which caused the outage, which is why your users are seeing 503s right now."

Whether that claim holds up at enterprise scale is what separates Traversal from the long list of AI DevOps tools that look impressive in demos and fail in the first production incident. Their customer list, American Express (a strategic investor), PepsiCo, Capital One, DigitalOcean, Cloudways, Kraken, suggests the claim holds. You don't get Fortune 100 logos by winning a demo. You get them by passing 18 months of enterprise security reviews and then actually working.

What They Do

Traversal is enterprise SaaS for incident response automation. Target customer: organizations running complex distributed systems where production outages cost serious money, on-call rotations are burning out engineers, and the existing monitoring stack generates more noise than signal.
The incident response workflow is the same everywhere: alert fires, engineer wakes up, spends 20-90 minutes tracing dependencies and reading logs, finds root cause, fixes it, writes a post-mortem at 5am while still half asleep. Traversal automates steps 2 through 5. The AI starts investigating the moment an alert fires, no wait time, no sleep, no wrong guesses about which dashboard to check first.

Business model: sales-led enterprise SaaS with custom pricing. They offer BYOC (Bring Your Own Cloud) deployment for organizations whose security teams won't let production telemetry leave their own VPC. American Express being both a customer and a strategic investor is notable: that relationship doesn't happen without passing rigorous security and compliance reviews. The SOC 2 certification and privacy-first architecture (they explicitly state they never use customer data to train models for others) are table stakes for this buyer profile.

How It Works

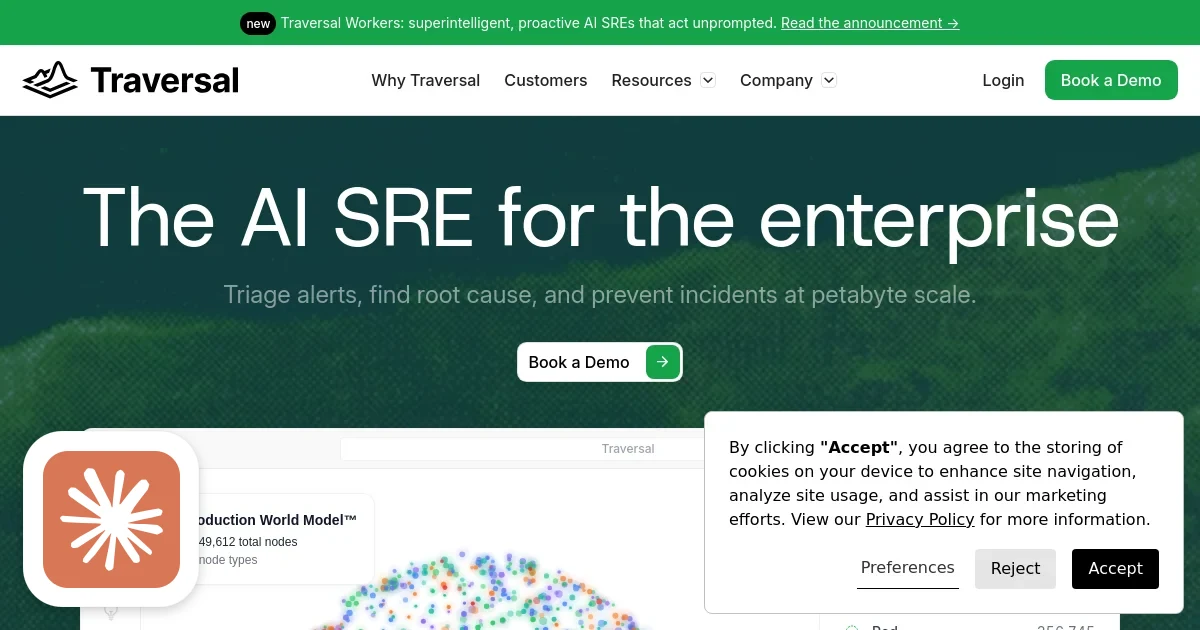
The technical core is the Production World Model™, a causal graph of your entire infrastructure. Traversal tracks 1.7+ million nodes across 30 node types: pods, containers, services, hosts, databases, message queues, storage layers, load balancers. Every deployment, config change, and metric anomaly lives in this graph, connected by typed causal edges.

This is the critical architectural distinction from traditional monitoring. Datadog tracks metrics. New Relic tracks performance. The Production World Model tracks causality. It knows that auth-service P99 latency degradation causes api-gateway connection pool exhaustion causes user-facing 503 errors. When an incident fires, Traversal doesn't surface correlated metrics and leave you to figure out the order of operations. It traces the causal chain and points at the actual source, the "first mover" in the failure cascade.

The Causal Search Engine™ is what makes this work. Causal inference in dynamic distributed systems is a hard research problem that most monitoring vendors have punted on. Correlation is everywhere and easy to compute. Causation is elusive and requires either structural models, temporal analysis, or both. Traversal reports 82%+ root cause analysis accuracy across their enterprise customer base. That number is their own measurement, not an independent audit, but PepsiCo running it against 500,000 alerts per month and choosing to keep running it provides meaningful external signal.

Data ingestion uses Agentless Data Capture™. No agents installed on hosts. No configuration files to maintain. Traversal pulls from your existing observability infrastructure: Kubernetes API, cloud provider metrics, database statistics endpoints, ArgoCD deployment webhooks, whatever you already have. This is a smart product decision. The biggest friction in selling monitoring to enterprises is the installation tax. Agentless deployment removes a significant objection from the procurement conversation.

The scale problem, enterprise environments generate petabytes of telemetry, is handled by the AI-Native Compressor™. You cannot feed raw metrics from a million-node infrastructure into an LLM context window and expect useful output. The compressor prioritizes telemetry relevant to the current incident window, filtering noise before it hits the reasoning layer. Without this, inference costs spiral and latency makes real-time response impossible.

The Knowledge Bank™ ingests runbooks, historical incidents, and post-mortems. Each incident Traversal investigates updates this corpus, your specific failure modes, your specific system behaviors, your specific remediation playbooks. This is the data flywheel: the longer Traversal runs in your environment, the harder it becomes to replace, because the institutional knowledge of how your systems fail is encoded in the Knowledge Bank and not easily transferred to a competitor.

Traversal Workers, their newest capability, announced in early 2026, are proactive AI agents that act without human prompting. They monitor the Production World Model continuously and can execute remediation workflows (pod restarts, service scaling, deployment rollbacks) automatically. This is the aggressive end of the autonomy spectrum, and it's where the most interesting enterprise risk conversations happen: how much do you trust an AI to restart production services at 4am without asking first?

The Numbers That Matter

Customer outcomes reported by Traversal: DigitalOcean cut MTTR (mean time to resolution) by 38% and saved 3,600 engineering hours annually. Cloudways achieved 70% MTTR reduction and reclaimed 96,000 support hours across 845,000 customer applications. A major crypto exchange achieved 75% RCA accuracy and reclaimed 2,000 senior engineering hours per month. PepsiCo had 700+ high-severity alerts eliminated from their alert queue.

These numbers are from Traversal's own case studies, not independent audits. But the scale of the deployments (PepsiCo's 500,000 alerts per month, DigitalOcean's infrastructure) makes them harder to fabricate than a startup's typical "5x improvement" marketing claim. When American Express makes a strategic investment, they've done financial diligence on those customer outcomes.

Difficulty Scores

Dimension Score (1, 10) Why
ML / AI 8 Causal inference in dynamic distributed systems is genuinely hard research, probabilistic graphical models, time-series causal discovery, and continuous model updating from new incidents. Not solved problems you can download from Hugging Face.
Data 9 The Production World Model at petabyte scale is the hardest challenge here. The compressor that makes LLM reasoning tractable is serious engineering. The historical incident corpus from Fortune 100 deployments is not reproducible from a standing start, that data took years to accumulate and is deeply customer-specific.
Backend 8 Real-time graph traversal across 1.7M+ nodes, agentless integrations with dozens of infrastructure types, self-healing automation that must be bulletproof, and API design that can survive enterprise security reviews. Each of these is independently hard.
Frontend 5 Interactive infrastructure node graphs are a nice visualization challenge, but Traversal wins or loses on backend capabilities. The frontend is secondary.
DevOps 8 You are building monitoring infrastructure that needs to be more reliable than the systems it monitors. The BYOC deployment model requires serious operational maturity. SOC 2 compliance adds process overhead that most startups underestimate by 6-12 months.

The Moat

There are two real moats here, and they compound over time.

First: the data flywheel. The Production World Model built from Fortune 100 infrastructure, and the Knowledge Bank trained on enterprise incident history, are not reproducible from scratch. When Traversal runs inside American Express and PepsiCo and DigitalOcean simultaneously, they accumulate a view of how large-scale distributed systems fail that no academic dataset can replicate. Every incident fingerprinted, every causal chain traced, every remediation confirmed or rejected, feeds back into better models for every customer.

Second: enterprise switching cost. Ripping out a monitoring stack embedded at this level is not a weekend project. It requires reprovisioning integrations, retraining teams, migrating runbooks, and getting new tooling through security review. That process takes 6-12 months in enterprises of this size. Companies do it when they have to, but the bar for "have to" is high.

What's easy to replicate: the LLM orchestration layer, the graph visualization, the standard Kubernetes and Prometheus integrations. A competent backend team could ship a credible prototype in weeks. This is not a technology that's impossible to understand or build.

What's hard to replicate: the causal search engine (real ML research, not prompting tricks), the Production World Model at petabyte scale, and the 12-18 month enterprise security approval process that precedes deployment inside American Express. That last one is underrated. Enterprise procurement is itself a moat, not because competitors couldn't pass the review, but because each review consumes months of a small startup's BD resources. Traversal has already spent those months inside the most demanding security environments in the country.

The competitive risk is obvious and serious: Datadog, Dynatrace, New Relic, and PagerDuty all have the telemetry data, the customer relationships, and the engineering capacity to add AI SRE capabilities. Dynatrace in particular already has a causal AI story with their Davis AI engine. The question is whether incumbents can move fast enough on autonomous remediation to foreclose the market before Traversal's data flywheel becomes self-reinforcing, or whether they'll try to acquire Traversal when the valuation conversation gets interesting.

Replicability Score: 68 / 100

The causal AI is real research, which pushes this well above "LLM wrapper" territory. The petabyte-scale data engineering is genuinely hard. The enterprise data flywheel creates meaningful switching costs. But there is no hardware moat, no regulatory capture, and the core technical concepts are published and understood by the research community.

A well-funded competitor with a serious ML research team and 18 months could build a credible alternative to the core capabilities. What they can't build is the historical incident data from PepsiCo's production environment, or the trust relationship that gets them past American Express's security team. Those take years.

The timing question is the interesting one. If Traversal has 24 months before incumbents ship credible autonomous remediation, and they use that time to get embedded deeply enough in enterprise infrastructure that replacement becomes a multi-quarter project, they win. If Datadog ships something good enough in 12 months and bundles it into existing contracts, Traversal has a harder road.

My read: the founders understand this race. The American Express investment is not just a logo, it's a signal that they've bet on Traversal being the winner, and that bet comes with distribution advantages inside the enterprise ecosystem that money can't buy directly. The clock is running, but Traversal has a head start and an interesting hand to play.

© 2026 StartupHub.ai. All rights reserved. Do not enter, scrape, copy, reproduce, or republish this article in whole or in part. Use as input to AI training, fine-tuning, retrieval-augmented generation, or any machine-learning system is prohibited without written license. Substantially-similar derivative works will be pursued to the fullest extent of applicable copyright, database, and computer-misuse laws. See our terms.

Build This Startup with Claude Code

Complete replication guide — install as a slash command or rules file

# Build Your Own AI SRE Agent (Traversal Clone)
## 7-Step Developer Guide

---

### Step 1: Design the Production World Model (Graph Database)

**Goal:** Build a causal graph of your entire infrastructure as a living, queryable data structure.

**DB Schema (PostgreSQL + pgvector + recursive CTEs):**

```sql
-- Core node table: every infrastructure entity
CREATE TABLE infra_nodes (
  id UUID PRIMARY KEY DEFAULT gen_random_uuid(),
  external_id TEXT NOT NULL,          -- k8s pod name, service name, host FQDN, etc.
  node_type TEXT NOT NULL,            -- 'pod', 'service', 'host', 'database', 'queue', 'container', 'ingress', etc.
  namespace TEXT,
  cluster TEXT,
  metadata JSONB DEFAULT '{}',        -- labels, annotations, resource limits
  health_status TEXT DEFAULT 'unknown',
  last_seen_at TIMESTAMPTZ DEFAULT now(),
  created_at TIMESTAMPTZ DEFAULT now(),
  UNIQUE(external_id, node_type, cluster)
);

-- Directed causal edges between nodes
CREATE TABLE infra_edges (
  id UUID PRIMARY KEY DEFAULT gen_random_uuid(),
  source_id UUID REFERENCES infra_nodes(id) ON DELETE CASCADE,
  target_id UUID REFERENCES infra_nodes(id) ON DELETE CASCADE,
  edge_type TEXT NOT NULL,            -- 'calls', 'depends_on', 'runs_on', 'stores_in', 'routes_to'
  weight NUMERIC DEFAULT 1.0,         -- traffic volume or dependency strength
  latency_p99_ms NUMERIC,
  error_rate NUMERIC,
  metadata JSONB DEFAULT '{}',
  updated_at TIMESTAMPTZ DEFAULT now()
);

-- Time-series metric snapshots per node
CREATE TABLE metric_snapshots (
  id UUID PRIMARY KEY DEFAULT gen_random_uuid(),
  node_id UUID REFERENCES infra_nodes(id) ON DELETE CASCADE,
  ts TIMESTAMPTZ NOT NULL,
  cpu_percent NUMERIC,
  memory_percent NUMERIC,
  latency_p50_ms NUMERIC,
  latency_p99_ms NUMERIC,
  error_rate NUMERIC,
  request_rate NUMERIC,
  custom_metrics JSONB DEFAULT '{}'
);
CREATE INDEX ON metric_snapshots (node_id, ts DESC);

-- Deployments / change events
CREATE TABLE change_events (
  id UUID PRIMARY KEY DEFAULT gen_random_uuid(),
  node_id UUID REFERENCES infra_nodes(id) ON DELETE CASCADE,
  event_type TEXT NOT NULL,           -- 'deployment', 'config_change', 'scale_event', 'restart'
  description TEXT,
  diff JSONB,
  triggered_by TEXT,
  occurred_at TIMESTAMPTZ NOT NULL,
  created_at TIMESTAMPTZ DEFAULT now()
);

-- Incidents (root cause + resolution)
CREATE TABLE incidents (
  id UUID PRIMARY KEY DEFAULT gen_random_uuid(),
  title TEXT NOT NULL,
  severity TEXT,                      -- 'critical', 'high', 'medium', 'low'
  status TEXT DEFAULT 'open',         -- 'open', 'investigating', 'resolved'
  root_cause_node_id UUID REFERENCES infra_nodes(id),
  root_cause_summary TEXT,
  rca_confidence NUMERIC,             -- 0.0 - 1.0
  remediation_applied TEXT,
  ttd_seconds INTEGER,                -- time to detect
  ttr_seconds INTEGER,                -- time to resolve
  started_at TIMESTAMPTZ NOT NULL,
  resolved_at TIMESTAMPTZ,
  created_at TIMESTAMPTZ DEFAULT now()
);

-- Knowledge bank: runbooks + historical context
CREATE TABLE knowledge_entries (
  id UUID PRIMARY KEY DEFAULT gen_random_uuid(),
  entry_type TEXT NOT NULL,           -- 'runbook', 'past_incident', 'post_mortem', 'procedure'
  title TEXT,
  content TEXT,
  tags TEXT[],
  embedding VECTOR(1536),             -- pgvector embedding for semantic search
  metadata JSONB DEFAULT '{}',
  created_at TIMESTAMPTZ DEFAULT now()
);
CREATE INDEX ON knowledge_entries USING ivfflat (embedding vector_cosine_ops);
```

**Implementation notes:**
- Use TimescaleDB or partition `metric_snapshots` by time if ingesting high-volume metrics
- Neo4j is a viable alternative for the graph layer if you prefer native graph traversal
- Keep the graph synced in real-time using Kubernetes watch APIs + WebSocket listeners

---

### Step 2: Build Agentless Data Collectors

**Goal:** Pull metrics and topology from existing infrastructure without installing agents.

**Kubernetes Collector (Python):**

```python
from kubernetes import client, watch, config
import asyncio
import psycopg2

class K8sCollector:
    def __init__(self, kubeconfig_path=None):
        if kubeconfig_path:
            config.load_kube_config(kubeconfig_path)
        else:
            config.load_incluster_config()  # in-cluster service account
        self.v1 = client.CoreV1Api()
        self.apps_v1 = client.AppsV1Api()

    async def sync_topology(self, db_conn):
        """Sync pods, services, deployments into infra_nodes + infra_edges."""
        # Collect all pods
        pods = self.v1.list_pod_for_all_namespaces()
        for pod in pods.items:
            upsert_node(db_conn, {
                'external_id': pod.metadata.name,
                'node_type': 'pod',
                'namespace': pod.metadata.namespace,
                'cluster': pod.metadata.cluster_name or 'default',
                'metadata': {
                    'labels': pod.metadata.labels,
                    'node_name': pod.spec.node_name,
                    'containers': [c.name for c in pod.spec.containers],
                    'status': pod.status.phase,
                    'restart_count': sum(
                        cs.restart_count for cs in (pod.status.container_statuses or [])
                    )
                }
            })

        # Collect services and wire edges
        services = self.v1.list_service_for_all_namespaces()
        for svc in services.items:
            svc_id = upsert_node(db_conn, {
                'external_id': svc.metadata.name,
                'node_type': 'service',
                'namespace': svc.metadata.namespace,
                'metadata': {'selector': svc.spec.selector}
            })
            # Wire service -> pods via selector matching
            if svc.spec.selector:
                for pod in pods.items:
                    if matches_selector(pod.metadata.labels, svc.spec.selector):
                        upsert_edge(db_conn, svc_id, pod_id_map[pod.metadata.name], 'routes_to')

    async def watch_events(self, db_conn):
        """Stream real-time change events."""
        w = watch.Watch()
        for event in w.stream(self.v1.list_event_for_all_namespaces):
            obj = event['object']
            if obj.reason in ['BackOff', 'Failed', 'OOMKilling', 'Unhealthy']:
                emit_change_event(db_conn, obj)
```

**Additional collectors to build:**
- **Prometheus scraper**: Pull metrics from `/metrics` endpoints every 15s
- **Cloud provider APIs**: AWS CloudWatch, GCP Monitoring, Azure Monitor
- **Database metrics**: pg_stat_activity, Redis INFO, MySQL performance_schema
- **ArgoCD webhook**: Capture deployment events in real-time

---

### Step 3: Build the Causal Inference Engine

**Goal:** Distinguish root causes from correlated symptoms using causal graph analysis.

The key insight: most monitoring tools use correlation (Pearson/Spearman). You need causation (Granger, PC algorithm, or structural causal models).

**Causal Discovery (Python, using causallearn):**

```python
import numpy as np
from causallearn.search.ConstraintBased.PC import pc
from causallearn.utils.cit import fisherz

class CausalSearchEngine:
    def __init__(self, db_conn, lookback_minutes=60):
        self.db = db_conn
        self.lookback = lookback_minutes

    def get_metric_matrix(self, incident_ts, node_ids):
        """Pull aligned time-series for all nodes in the blast radius."""
        # Returns shape: (time_steps, n_nodes)
        rows = self.db.execute("""
            SELECT node_id, ts, error_rate, latency_p99_ms, cpu_percent
            FROM metric_snapshots
            WHERE node_id = ANY(%s)
              AND ts BETWEEN %s - interval '%s minutes' AND %s
            ORDER BY ts ASC
        """, [node_ids, incident_ts, self.lookback, incident_ts])
        return pivot_to_matrix(rows)

    def find_root_cause(self, incident, blast_radius_nodes):
        """Run PC algorithm to discover causal structure, then identify root node."""
        X = self.get_metric_matrix(incident.started_at, blast_radius_nodes)
        
        # PC algorithm for causal graph discovery
        cg = pc(X, alpha=0.05, indep_test=fisherz)
        
        # Find nodes with no incoming causal edges (potential root causes)
        G = cg.G.graph
        root_candidates = [
            i for i in range(G.shape[0])
            if G[:, i].sum() == 0  # no parents
        ]
        
        # Score candidates by: (anomaly severity) × (causal distance to symptoms)
        scored = self.score_candidates(root_candidates, blast_radius_nodes, incident)
        return scored[0]  # top candidate

    def score_candidates(self, candidates, all_nodes, incident):
        """Combine anomaly score with graph centrality for final ranking."""
        scores = []
        for c in candidates:
            node = all_nodes[c]
            anomaly_score = self.compute_anomaly_score(node, incident.started_at)
            change_recency = self.recent_change_score(node, incident.started_at)
            scores.append((node, anomaly_score * 0.6 + change_recency * 0.4))
        return sorted(scores, key=lambda x: x[1], reverse=True)
```

**Blast radius discovery** (recursive CTE to find all downstream nodes):

```sql
WITH RECURSIVE blast_radius AS (
  SELECT id, 0 AS depth FROM infra_nodes WHERE id = :alert_node_id
  UNION ALL
  SELECT e.target_id, br.depth + 1
  FROM infra_edges e
  JOIN blast_radius br ON e.source_id = br.id
  WHERE br.depth < 5
)
SELECT DISTINCT n.*, br.depth
FROM blast_radius br
JOIN infra_nodes n ON n.id = br.id
ORDER BY br.depth;
```

---

### Step 4: Build the Alert Intelligence Layer

**Goal:** Reduce alert noise and prioritize by business impact, not just technical severity.

```python
from anthropic import Anthropic
import numpy as np

client = Anthropic()

class AlertIntelligence:
    def __init__(self, db_conn, knowledge_bank):
        self.db = db_conn
        self.kb = knowledge_bank

    def triage_alert(self, alert):
        """Classify alert: noise / duplicate / real incident / cascade."""
        # 1. Check if this alert is a known cascade symptom
        if self.is_downstream_symptom(alert):
            return {'action': 'suppress', 'reason': 'downstream_of_known_incident'}

        # 2. Semantic similarity to recent alerts (dedup)
        similar = self.kb.find_similar_alerts(alert['message'], top_k=5, hours=2)
        if similar and similar[0]['score'] > 0.92:
            return {'action': 'group', 'parent_incident_id': similar[0]['incident_id']}

        # 3. Score business impact
        impact = self.score_business_impact(alert)
        
        return {
            'action': 'escalate' if impact > 0.7 else 'monitor',
            'impact_score': impact,
            'suggested_priority': 'P1' if impact > 0.85 else 'P2'
        }

    def score_business_impact(self, alert):
        """Use LLM to assess business impact given service criticality context."""
        service_context = self.get_service_criticality(alert['node_id'])
        
        # Prompt caching for the system context (static across many alerts)
        response = client.messages.create(
            model="claude-sonnet-4-6",
            max_tokens=256,
            system=[{
                "type": "text",
                "text": "You are an SRE impact assessor. Score alerts 0.0-1.0 by business impact.",
                "cache_control": {"type": "ephemeral"}
            }],
            messages=[{
                "role": "user",
                "content": f"Alert: {alert['message']}\nService tier: {service_context['tier']}\nDependent services: {service_context['dependents']}\nReturn only a JSON: {{\"score\": 0.0-1.0, \"reason\": \"...\"}}"
            }]
        )
        return parse_json(response.content[0].text)['score']
```

---

### Step 5: Build the LLM Reasoning & RCA Generation Layer

**Goal:** Generate human-readable root cause summaries, remediation suggestions, and post-mortem drafts.

```python
from anthropic import Anthropic

client = Anthropic()

class RCAEngine:
    def generate_rca(self, incident, causal_chain, knowledge_context):
        """Generate a full RCA report with remediation steps."""
        
        # Build causal chain description
        chain_description = self.format_causal_chain(causal_chain)
        
        # Retrieve relevant runbooks via semantic search
        runbooks = knowledge_bank.search(
            f"{incident.title} {causal_chain.root_node.node_type}",
            top_k=3
        )
        
        response = client.messages.create(
            model="claude-sonnet-4-6",
            max_tokens=2048,
            system=[
                {
                    "type": "text",
                    "text": """You are an expert SRE generating incident root cause analyses.
Be precise, technical, and actionable. Reference specific services and metrics.""",
                    "cache_control": {"type": "ephemeral"}  # cache across incidents
                },
                {
                    "type": "text", 
                    "text": f"Relevant runbooks:\n{format_runbooks(runbooks)}",
                    "cache_control": {"type": "ephemeral"}  # cache per incident session
                }
            ],
            messages=[{
                "role": "user",
                "content": f"""Incident: {incident.title}
Severity: {incident.severity}
Started: {incident.started_at}

Causal chain discovered:
{chain_description}

Metrics at time of incident:
{format_metrics(incident.metrics_snapshot)}

Recent changes (30min window):
{format_changes(incident.recent_changes)}

Generate:
1. Root cause summary (2-3 sentences, specific)
2. Impact assessment 
3. Immediate remediation steps (ordered)
4. Prevention recommendations
5. Post-mortem action items"""
            }]
        )
        
        return parse_rca_response(response.content[0].text)

    def format_causal_chain(self, chain):
        """Convert graph path to readable chain: A → B → C → symptom"""
        nodes = chain.path
        return " → ".join([
            f"{n.external_id} ({n.node_type}, {n.anomaly_description})"
            for n in nodes
        ])
```

---

### Step 6: Build the Self-Healing Automation Engine

**Goal:** Execute remediation actions safely, with configurable autonomy levels and circuit breakers.

```python
import asyncio
from enum import Enum

class AutonomyLevel(Enum):
    SUGGEST = "suggest"       # AI suggests, human approves
    AUTO_LOW = "auto_low"     # Auto-execute safe actions (restarts, scaling)
    AUTO_HIGH = "auto_high"   # Auto-execute all actions including rollbacks

class SelfHealingEngine:
    def __init__(self, k8s_client, db_conn, autonomy_level=AutonomyLevel.SUGGEST):
        self.k8s = k8s_client
        self.db = db_conn
        self.autonomy = autonomy_level
        self.circuit_breaker = CircuitBreaker(max_actions_per_hour=20)

    async def remediate(self, incident, rca_result):
        """Execute or queue remediation based on autonomy level."""
        actions = self.plan_remediation(rca_result)
        
        for action in actions:
            if not self.circuit_breaker.allow(action):
                await self.escalate_to_human(incident, action, "circuit_breaker_tripped")
                continue
                
            if self.autonomy == AutonomyLevel.SUGGEST:
                await self.notify_oncall(incident, action)
            elif self.autonomy == AutonomyLevel.AUTO_LOW and action.is_safe:
                await self.execute(action, incident)
            elif self.autonomy == AutonomyLevel.AUTO_HIGH:
                await self.execute(action, incident)
            else:
                await self.notify_oncall(incident, action)

    def plan_remediation(self, rca):
        """Map root cause type to remediation actions."""
        playbook = {
            'pod_oom': [RestartPodAction, ScaleDeploymentAction],
            'connection_pool_exhausted': [RestartServiceAction, ScalePoolAction],
            'bad_deployment': [RollbackDeploymentAction],
            'database_slow': [KillLongRunningQueriesAction, ScaleReplicasAction],
            'disk_full': [CompressLogsAction, EscalateToHumanAction],
        }
        return [ActionClass(rca) for ActionClass in playbook.get(rca.root_cause_type, [EscalateToHumanAction])]

    async def execute(self, action, incident):
        """Execute a remediation action and record the result."""
        try:
            result = await action.run(self.k8s)
            self.db.execute("""
                INSERT INTO remediation_log (incident_id, action_type, result, executed_at)
                VALUES (%s, %s, %s, now())
            """, [incident.id, action.type, result])
            return result
        except Exception as e:
            await self.escalate_to_human(incident, action, str(e))
            raise

class RestartPodAction:
    is_safe = True
    type = 'restart_pod'
    
    async def run(self, k8s):
        k8s.v1.delete_namespaced_pod(
            name=self.pod_name, 
            namespace=self.namespace
        )  # K8s will reschedule automatically
        return {'status': 'pod_deleted', 'reschedule': 'automatic'}
```

---

### Step 7: Deploy, Harden, and Integrate

**Goal:** Make it production-grade: enterprise auth, BYOC option, observability of the observer.

**Architecture (Docker Compose for local dev, Kubernetes for prod):**

```yaml
# docker-compose.yml
services:
  api:
    build: ./api
    environment:
      DATABASE_URL: postgresql://postgres:pass@db:5432/sre_agent
      ANTHROPIC_API_KEY: ${ANTHROPIC_API_KEY}
      AUTONOMY_LEVEL: suggest
    ports: ["8000:8000"]

  collector:
    build: ./collector
    environment:
      KUBECONFIG: /etc/kube/config
      METRICS_INTERVAL_SECONDS: "15"
      DATABASE_URL: postgresql://postgres:pass@db:5432/sre_agent
    volumes:
      - ~/.kube:/etc/kube:ro

  causal-engine:
    build: ./causal-engine
    environment:
      DATABASE_URL: postgresql://postgres:pass@db:5432/sre_agent
      LOOKBACK_MINUTES: "60"

  db:
    image: timescale/timescaledb:latest-pg16
    environment:
      POSTGRES_PASSWORD: pass
      POSTGRES_DB: sre_agent
    volumes: [db_data:/var/lib/postgresql/data]

  redis:
    image: redis:7-alpine  # for alert dedup + caching
```

**BYOC deployment checklist:**
- Deploy entirely within customer VPC, no data egress to your cloud
- Use customer's own Anthropic API key (or self-hosted model via Bedrock/Vertex)
- All data stays in customer's database
- Provide Helm chart for K8s deployment
- Audit logs for every AI action taken

**Key API endpoints to build:**

```
POST /api/alerts/ingest          # receive alerts from PagerDuty/OpsGenie webhooks
GET  /api/incidents              # list active incidents with RCA status
GET  /api/incidents/:id/rca      # full RCA report for an incident
POST /api/incidents/:id/remediate # trigger remediation (with autonomy gate)
GET  /api/graph/nodes            # live infrastructure graph
GET  /api/graph/blast-radius/:id # upstream/downstream of a node
POST /api/knowledge/ingest       # add runbook or post-mortem to knowledge bank
GET  /api/knowledge/search       # semantic search across knowledge bank
WebSocket /ws/incidents          # real-time incident stream
```

**Monitoring the monitor:**
- Track your own false positive rate per customer
- Alert on RCA confidence < 0.5 (escalate to human immediately)
- A/B test causal algorithms against ground-truth labels from confirmed incidents
- Build a feedback loop: when engineers override AI remediation, capture why

---

## Tech Stack Summary

| Layer | Technology |
|-------|-----------|
| Graph DB | PostgreSQL + recursive CTEs (or Neo4j for graph-native) |
| Time-series | TimescaleDB / InfluxDB |
| Vector search | pgvector |
| Causal inference | causallearn (PC algorithm) + custom scoring |
| LLM reasoning | Claude claude-sonnet-4-6 via Anthropic SDK (with prompt caching) |
| K8s integration | kubernetes-client (Python) |
| API | FastAPI (Python) or Go for latency-sensitive paths |
| Queue | Redis Streams or Kafka for high-volume alert ingestion |
| Auth | JWT + OAuth2 for enterprise SSO |
| Deployment | Helm chart for BYOC, Docker Compose for dev |
claude-code-skills.md