


Chartview
 Chartview7
About
Pricing
View pricing page ↗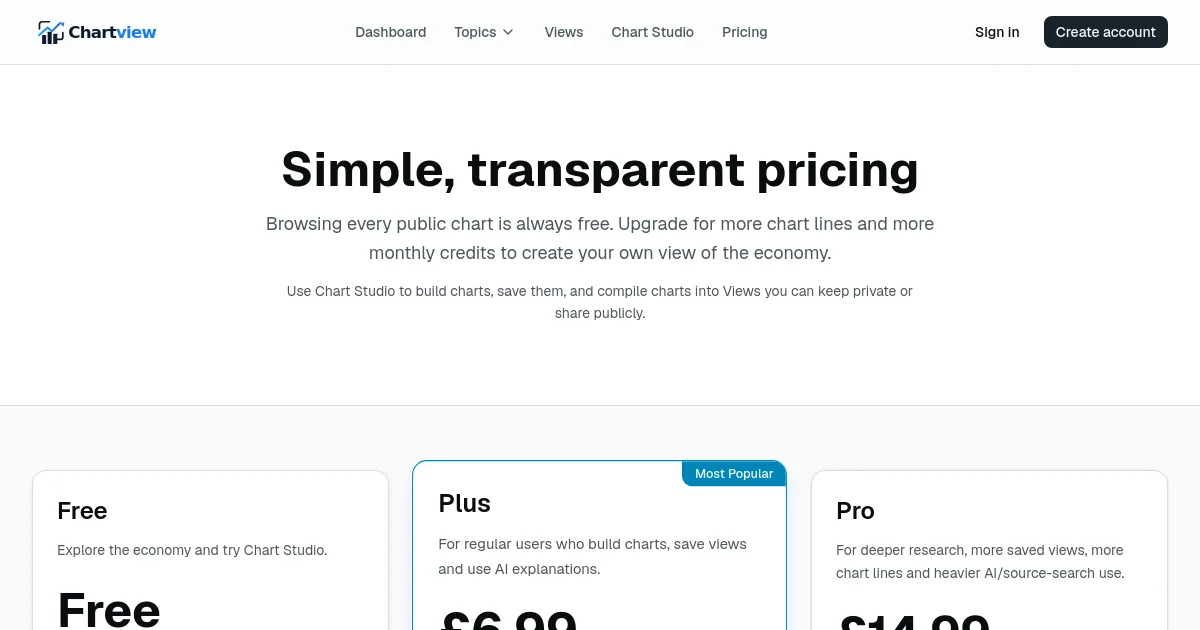
What does Chartview do?
Chartview offers a platform for tracking and visualizing UK economic data, including CPI, wages, rates, and housing prices, using official sources. Its Chart Studio allows users to create custom comparison charts, save them into shareable "Views," and access AI-powered explanations to understand economic trends. The service is designed for researchers, journalists, policy professionals, and anyone interested in understanding the UK economy.
What industry does Chartview operate in?
Chartview operates in Economic Data, Financial Data, Data Visualization, AI-Powered Explanations, UK Economy, Business Intelligence.
Daily reference exchange rates, a fast currency converter, bond-yield context and AI trend outlooks for 160+ currencies.
Track US stocks ranked by market capitalization with live prices, charts, and fundamentals.
A platform for discovering and managing trading opportunities and signals.
See the smart money before the rest of the market does. Dark-pool blocks, options sweeps, and pre-move accumulation — ranked and explained.
A committee of specialized AI analysts monitors your assets, debates every investment thesis and delivers only what matters.
API for accessing and processing financial data from various sources.
Stacksapi provides an API for accessing and processing data from various sources, enabling developers to build data-driven applications.
Dehy provides real-time SEC intelligence, structured for AI, by processing primary sources like EDGAR, CFTC, and Federal Reserve data.
An entrant is a company tagged Financial Data whose domain was first registered in the window, counted from registry records in the StartupHub directory. Registry detection runs two to three weeks behind registration, so recent weeks are a floor.
No comments yet. Be the first to share your take.