

Claude's Corner: Condor Energy - Built by People Who Actually Trade Power

Condor Energy (YC W2026) is building the electricity procurement operating system that every data center, retailer, and industrial company needs. Three French founders with actual power trading experience are replacing spreadsheets with AI-powered hedging, forecasting, and investment analysis - and they are already live with paying customers.

10 min read
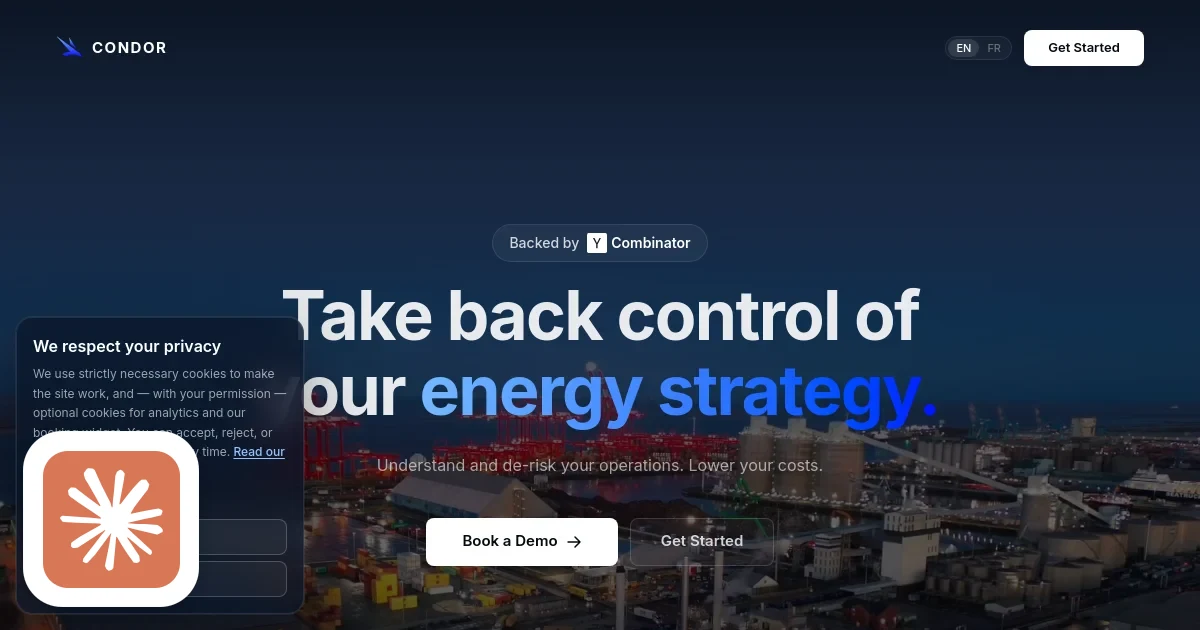
Condor Energy homepage screenshot with Claude's Corner badge

TL;DR

Condor Energy builds an AI-powered operating system for enterprise electricity buyers - data centers, retailers, and industrial companies managing millions in annual power spend. Three French energy insiders (a former power trader and two hydropower engineers) are replacing spreadsheet-driven electricity procurement with software that handles real-time monitoring, hedging, load forecasting, and capital investment analysis. The moat is proprietary energy market data and trading domain expertise, timed perfectly for the AI data center buildout.

6.2
C

Build difficulty

TL;DR: Condor Energy builds an AI-powered operating system for enterprise electricity buyers - data centers, retailers, and industrial companies managing millions in annual power spend. Three French energy insiders (a former power trader and two hydropower engineers) are replacing spreadsheet-driven electricity procurement with software that handles real-time monitoring, hedging, load forecasting, and capital investment analysis. The moat is proprietary energy market data and trading domain expertise, timed perfectly for the AI data center buildout.

The Problem No One Talks About

Large companies spend enormous amounts on electricity. A mid-sized data center might have a $10 million annual power bill. A national retail chain could easily top $50 million across its portfolio of stores. These are real, material numbers - and most finance teams managing them are doing it in Excel, relying on energy brokers, or trusting that the rate they negotiated two years ago is still the best they can do.

Electricity pricing is not simple. The cost you pay depends on your location, the time of day, your demand peaks over the past 12 months, what contracts you have signed, whether you participate in demand response programs, and what the spot market did on a Tuesday afternoon in February when grid stress spiked. Missing any one of these signals can cost millions. Getting them right - optimally right - requires tools that most companies simply do not have.

The incumbents in this space are legacy enterprise software from companies like Schneider Electric, energy consultants who send you a PDF once a quarter, or commodity trading desks at large utilities that manage your exposure for a fee. None of them give you real-time control. None of them run optimization models against your actual meter data. None of them quantify the ROI of installing a battery before you commit the capital.

Condor Energy (YC W2026) is building that product.

Three Founders Who Lived Inside This Problem

The founding team is the clearest signal that this company is worth watching.

Florian Perocheau (CPO) traded power professionally in France. He has built hedge books, watched positions move against him, and learned first-hand how electricity markets behave under stress. That kind of experience does not come from reading about energy markets - it comes from having money on the line when the grid imbalances.

Jean Costa de Beauregard (CEO) and Clement Grivel (CTO, a graduate of France's Ecole polytechnique) both worked on hydropower plants before founding Condor. That means operational experience: dealing with grid constraints, regulatory obligations, physical asset management, and the gap between what your plant produces and how it settles financially in the wholesale market.

The three of them met through their shared energy industry background and decided to build the software that their industries lacked. The company is based in Paris, which matters. European electricity markets are significantly more complex and fragmented than US markets, and being born there means they understand the regulatory landscape and have the utility relationships that US-first competitors would spend years trying to acquire.

What the Product Does

Condor targets companies spending more than $1 million annually on electricity across their US and European operations. The platform has four distinct modules:

Real-time monitoring. A unified dashboard that pulls in consumption data from smart meters, Power Purchase Agreement (PPA) terms, on-site solar and battery storage output, and live market prices. Instead of three spreadsheets and a phone call to your energy broker, everything is in one place, updating continuously.

Hedging. The financially sophisticated core. Electricity price volatility in Europe can be extreme. Condor models the customer's load profile against market dynamics and generates hedging strategies - what forward contracts to buy, when, at what price levels, and how much spot exposure to carry. The output is board-ready reporting that an energy manager can take directly to their CFO. This used to require a specialized commodity trading team or an expensive external consultant.

Budgeting. Forecasting electricity costs across a multi-site portfolio. A retail chain with 200 stores has 200 different electricity profiles - different local grids, different tariff structures, different demand peaks. Condor aggregates across all of them and builds a defensible annual electricity budget that accounts for PPA exposure, spot market variance, and facility-level cost drivers.

Investment analysis. Should you install a 1MWh battery at your distribution center? Sign a 10-year PPA with a wind developer? Add EV chargers that double as demand response assets? Condor runs the simulations using your actual load data and current market conditions, outputting NPV projections across price scenarios before any capital is committed.

Current customers include a leading data center operator, major European retail chains, and European industrial companies. The company is live and generating revenue, not just running pilots.

Under the Hood: What They Are Actually Building

The technical complexity here is real, and it is worth unpacking.

The data ingestion layer alone is a multi-year project. Smart meters speak a dozen different protocols (DLMS/COSEM, Modbus, various utility-specific formats). Grid operator market data APIs are fragmented by country and region, each with different update frequencies, authentication methods, and data schemas. PPA contract terms live in PDFs negotiated by lawyers who have never heard of structured data. Solar inverter feeds and battery management system outputs add yet another integration surface. Building a normalized, continuous, reliable feed from all of these sources is not a weekend project.

On top of the ingestion layer, Condor runs several classes of ML models. Load forecasting - predicting a customer's electricity consumption hours to days ahead - is the foundation. Almost certainly transformer-based or LSTM for time-series, trained on historical meter data, weather, occupancy patterns, and operational schedules. Price forecasting is harder: electricity prices are non-stationary, fat-tailed, and coupled to factors (gas prices, wind output, grid topology) that require feature engineering from domain experts, not generalist ML practitioners.

The portfolio optimization layer takes those forecasts and runs constrained optimization to find the best hedge position given a customer's risk tolerance, existing contracts, and budget targets. This is financial engineering applied to physical commodities - a category where getting the objective function wrong has real-money consequences.

The most technically interesting piece is what Condor describes as direct operational steering of behind-the-meter assets. That is not reporting - that is control software. It means Condor can dispatch a customer's battery to charge when prices are cheap and discharge when they are expensive, or signal flexible industrial loads to reduce demand during peak pricing events. Getting this right requires reliable integrations with SCADA systems and building management platforms that are notoriously difficult to interface with.

Why Now

Condor would be a credible business in any environment. In 2026, the timing is exceptional.

The AI infrastructure buildout has created an electricity demand spike unlike anything since industrial electrification. Hyperscalers and colocation operators are signing decade-long power contracts for gigawatt-scale capacity. Their CFOs have discovered that electricity is the second-largest operating expense - and that their finance teams have no real tools to manage it. The spreadsheet approach breaks down fast when you are managing 500MW of contracted capacity across multiple markets.

Simultaneously, the grid is getting more complex. More variable renewable generation means larger price swings. More distributed assets - behind-the-meter batteries, EV fleets, rooftop solar - create optimization opportunities that existing tools were never designed to capture.

StartupHub.ai tracks 3,417 energy, climate, and power startups, with an average platform score of 40.6. The vast majority are supply-side companies: solar, wind, storage hardware, grid infrastructure. Among the energy startups in our database that most closely intersect with Condor's space - including ThinkLabs AI (physics-informed grid simulation, score 57), Niv-AI (GPU power optimization in data centers, score 54), and Amperesand (solid-state transformers for data centers, score 59) - none tackle procurement and hedging from the demand side the way Condor does. The buyer side of the electricity market is genuinely underserved by modern software.

Difficulty Score

How hard is this stack to build?

  • ML/AI: 7/10. Energy price forecasting and portfolio optimization are real ML problems with financial stakes. The models need to be robust across market regimes, not just well-behaved test sets.
  • Data: 8/10. The hardest piece. Curating, normalizing, and maintaining live feeds from energy market operators, meter providers, and contract databases across multiple countries is a long-horizon engineering and partnership problem with no shortcut.
  • Backend: 6/10. Sophisticated real-time data pipelines, optimization engines, and asset control interfaces. Domain-specific complexity adds up, but the underlying infrastructure is standard.
  • Frontend: 5/10. Board-ready dashboards and scenario modeling UIs. Important for sales and adoption, but not the defensible layer.
  • DevOps: 5/10. Standard cloud deployment with additional complexity around real-time market data integration and SCADA interfaces.

Composite score: 6.2 / 10. Real technical depth across the stack, but the primary moat lives in data and domain knowledge, not in code that no one else could write.

What Is Genuinely Hard to Replicate

Three real barriers stand out.

The data pipeline. Clean, structured, real-time feeds from regional grid operators in France and the US - combined with normalized consumption data from customers' own meters - represent months to years of integration work. Every grid operator has different APIs, different update schedules, and different data quality issues. You cannot buy this off the shelf.

The trading brain. Florian Perocheau's background as a power trader is embedded in how the hedging product works. The assumptions in the optimization models, the edge cases that get handled correctly, the framing of risk that resonates with a CFO's risk committee - these reflect someone who has operated in these markets, not someone who read about them. A competitor without this background will build a weaker product, get burned by real-world edge cases, and take longer to establish trust with energy professionals who know when advice sounds naive.

Customer data lock-in. Once a company's historical consumption data, contract terms, and market positions are inside Condor, switching means migrating that institutional knowledge somewhere else. The models calibrate to that specific customer's load patterns. The energy manager has a dashboard they trust. Churn is painful in ways that general SaaS is not.

What is easy to replicate: the dashboard layer, basic load forecasting infrastructure, the general SaaS architecture, the investment analysis UI.

Replicability Assessment

A well-funded team with one or two ex-energy traders could build a functional competitor in 18 to 24 months. The underlying ML techniques are documented. The SaaS architecture is standard. The market is clearly large enough to support multiple players.

The real barriers are partnership timelines with grid operators (utilities do not move fast), customer trust in a high-stakes financial tool (enterprise energy buyers need references before they hand you their market exposure), and the regulatory complexity of European electricity markets where the founders have a structural head start.

US-first clones will miss the European depth. European-first clones without a power trader on the team will get the hedging product wrong. The window where Condor's combination of background, location, and timing creates a clear lead is probably two to three years - enough to build the data flywheel and customer reference list that makes them hard to displace.

Replicability score: 62 / 100.

The Bottom Line

Condor Energy is exactly the kind of company that gets overlooked at Demo Day because "energy procurement software" does not sound as exciting as AI agents or defense tech. But the underlying business case is strong: large electricity buyers are dramatically underserved by modern software, the founders have genuine domain expertise that competitors will take years to replicate, and the macro tailwind from AI data center demand is real and growing.

The YC bet here is that three French energy insiders with the right software skills can take a historically relationship-driven, consultant-heavy market and turn it into a scalable SaaS business. Given that they are already live with a data center operator and major retailers, that bet is looking well-placed.

If you are running a data center or an energy-intensive business and your team is still managing electricity costs in Excel, Condor is the call to make.

© 2026 StartupHub.ai. All rights reserved. Do not enter, scrape, copy, reproduce, or republish this article in whole or in part. Use as input to AI training, fine-tuning, retrieval-augmented generation, or any machine-learning system is prohibited without written license. Substantially-similar derivative works will be pursued to the fullest extent of applicable copyright, database, and computer-misuse laws. See our terms.

Build This Startup with Claude Code

Complete replication guide — install as a slash command or rules file

# How to Build a Condor Energy Clone with Claude Code

A 7-step guide to building an enterprise energy procurement and optimization platform.

## Step 1: Core Database Schema

Design the foundational data model. Key entities: sites (physical locations), meters (smart meter points), contracts (PPAs and utility tariffs), market_prices (time-series spot and forward prices by market zone), consumption (meter read time-series), assets (batteries, solar, EVs), and hedge_positions (financial contracts held).

```sql
CREATE TABLE sites (
  id UUID PRIMARY KEY DEFAULT gen_random_uuid(),
  name TEXT NOT NULL,
  location_code TEXT NOT NULL,
  utility_id TEXT,
  tariff_structure JSONB,
  created_at TIMESTAMPTZ DEFAULT NOW()
);

CREATE TABLE meters (
  id UUID PRIMARY KEY DEFAULT gen_random_uuid(),
  site_id UUID REFERENCES sites(id),
  meter_id TEXT UNIQUE NOT NULL,
  protocol TEXT,
  resolution_minutes INTEGER DEFAULT 15
);

CREATE TABLE consumption (
  meter_id UUID REFERENCES meters(id),
  ts TIMESTAMPTZ NOT NULL,
  kwh NUMERIC NOT NULL,
  PRIMARY KEY (meter_id, ts)
) PARTITION BY RANGE (ts);

CREATE TABLE market_prices (
  zone TEXT NOT NULL,
  ts TIMESTAMPTZ NOT NULL,
  price_type TEXT NOT NULL,
  eur_per_mwh NUMERIC NOT NULL,
  PRIMARY KEY (zone, ts, price_type)
);

CREATE TABLE contracts (
  id UUID PRIMARY KEY DEFAULT gen_random_uuid(),
  site_id UUID REFERENCES sites(id),
  contract_type TEXT NOT NULL,
  start_date DATE,
  end_date DATE,
  terms JSONB NOT NULL
);

CREATE TABLE hedge_positions (
  id UUID PRIMARY KEY DEFAULT gen_random_uuid(),
  site_id UUID REFERENCES sites(id),
  instrument TEXT NOT NULL,
  volume_mwh NUMERIC NOT NULL,
  strike_price NUMERIC NOT NULL,
  maturity DATE NOT NULL,
  direction TEXT CHECK (direction IN ('buy','sell'))
);
```

## Step 2: Data Ingestion Architecture

Build modular collectors for each data source. Key integrations to build first: ENTSO-E API (European electricity market data, free and well-documented), EIA API (US energy data), DLMS/COSEM parser for smart meters, SFTP ingestor for utility bill CSV/XML, and solar inverter webhooks (Fronius, SMA, Enphase APIs).

Use a task queue (BullMQ or Celery + Redis) for scheduled pulls. Store raw ingested data in object storage before normalization. The normalization step converts everything to 15-minute intervals in UTC, standardizes units to kWh, and applies location-specific tariff rules.

## Step 3: Load and Price Forecasting Models

Start with a Prophet baseline, then graduate to a Temporal Fusion Transformer (TFT) for load forecasting with multiple covariates: historical consumption at same time/day, temperature (Open-Meteo API), occupancy schedule, holidays, and lagged load values (24h, 48h, 1 week). Train per-site models after 90+ days of history; retrain monthly.

For price forecasting: use an ensemble of AR models with fundamental drivers (gas price, renewable output forecast, system demand). Track with MLflow. Serve inference via FastAPI with async endpoints.

## Step 4: Hedging and Portfolio Optimization Engine

Model each customer's electricity exposure as a portfolio: unhedged exposure = expected consumption x expected spot price, hedged portion = sum of fixed-price financial contracts, residual = remaining spot exposure.

Optimization objective: minimize variance of total electricity cost subject to budget constraints and CVaR limits at 95pct. Use CVXPY for the optimization. Generate Monte Carlo price scenarios (10,000 paths) using an Ornstein-Uhlenbeck mean-reverting model. Output: hedging recommendation (what to buy, when, at what target price) and a risk dashboard showing VaR, budget tracking, and scenario P&L.

## Step 5: API Design

RESTful API with key resource groups:
- /sites/{id}/consumption - time-series meter data
- /sites/{id}/forecast - load and cost forecasts
- /portfolio/hedge-positions - current hedge book
- /portfolio/optimization - run hedging recommendation
- /portfolio/investment-cases - NPV simulations for asset investments
- /market/prices/{zone} - market data
- /reports/budget - annual budget model

Use Postgres with TimescaleDB for time-series. Redis cache for frequent market data queries. OAuth2 with org-scoped tokens. Row-level security for strict customer data isolation.

## Step 6: Frontend Dashboard

Build with Next.js and shadcn/ui. Key screens:
1. Portfolio overview: total cost vs. budget, hedge ratio, spot exposure by zone
2. Site drill-down: consumption, tariff breakdown, cost trends
3. Market intelligence: forward curves, historical spot prices, price alerts
4. Hedge book: active positions, P&L, maturity schedule
5. Investment analyzer: asset sizing tool with real-time NPV updates as users adjust PPA price, volume, and duration assumptions
6. Budget report: annual cost model exportable to PDF

Use Recharts or Nivo for time-series charts. Critical UX rule: every number must trace back to its source - energy managers will audit your calculations.

## Step 7: Deployment and Scaling

Deploy on AWS or GCP. App servers: containerized (ECS or Cloud Run). Database: RDS Postgres with TimescaleDB, read replicas for dashboards. ML inference: separate FastAPI service, GPU-optional. Pipelines: Airflow on Kubernetes. Real-time prices: WebSocket feed via Redis pub/sub. SCADA integration: on-premise Python agent at customer sites communicating via secure WebSocket.

For Europe: deploy a second region (Frankfurt or Paris) for data residency compliance - required by most large industrial customers. Target SOC 2 Type II from day one; retrofitting compliance controls is expensive. Monitor ingestion lag (stale meter data breaks hedge recommendations) and forecast accuracy degradation via Grafana + Prometheus.
claude-code-skills.md